Nur Hüseyin – 18017
https://nbviewer.jupyter.org/github/assdfo/CS210project_ML/blob/master/project.ipynb

Project Description
Movie preferences of people diverge into groups. In this project, my goal is to analyze and display statistical facts in different movie genres that indicates people who ranked high for action/fantasy movies will rank mostly low for drama/romantic movies. I will explore how ratings are grouped in certain movie genres by choosing specific genres. In conclusion, I will group some of the movie genres and explore their correlation with ratings.
Dataset
I have obtained the dataset from from Kaggle. It uses 20 million ratings applied to 27,000 movies by 138,000 users. This dataset includes three raw csv files named as movies.csv, ratings.csv and tags.csv
-
- movies.csv has three columns storing values of movieId, title and genre. Title has got the release year of movie in parenthesis. There are 27.3k rows since there are around 27,000 movies.
- ratings.csv has four columns which are userId, movieId, rating, and timestamp. Movies are rated by 138.493 users on the scale of 1 to 5. There are 20 million rows since this is the number of rates. All users rate to different movies, so there are multiple ratings for every user.
- Tags.csv file has columns userId, movieId, and tag however this file will not be used in my analysis.
url of dataset: https://www.kaggle.com/ashukr/movie-rating-data
Dataset Preparation
movie.csv dataset has movieId, title and genres information in it. We use movieId and genres. We will have connection between other data from movieId information. ratings data has userId, movieId and rating information.
In my ratings data, since I don’t use timestamp information, I delete(drop) it from the dataset. Preprocessing will be faster this way. In addition, I have created 2 new columns. These columns have information about movies only which have genre that includes “Action” and “Drama” in it. Genres that includes both “Action” and “Drama” also didn’t take in to consideration.
In this project, I want to show that people who ranked high for Drama movies voted low for Action movies and vice versa.
I created a new DataFrame. This will be the dataset I use mainly. It has unique userId’s, this is its difference from rating.csv data. I calculated average ratings these users voted for both Drama and Action included movies, diversely. In addition, I created two more columns for the number of movies this user voted which includes Drama and Action in its genre, respectively.
Hypothesis Testing

I try to prove that rating high for one genre will be rating low for other genre. Above, graph is according to rating high for Drama and low for Action. Now, I applied a significance test to statistically approve this difference. Here, we created two different samples, extracting values only for users which rated high for drama movies. They rated for action movies as well. We compare mean of drama with mean of action in scope of users that rated high for drama. Since we have two samples, we simply decided to apply two-sample t-test to show that two eras are different. Below, you may find the hypothesis statements.
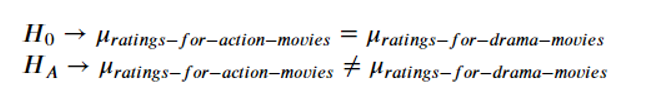
We set the significance level as 0.05 as general.
Ttest_indResult(statistic=2.947813420785039, pvalue=0.0033385778154450554)
Based on the value of obtained p_value, we
can “reject” the
null hypothesis.
Decision Tree
Decision trees are supervised Machine Learning algorithms. In the code, algorithm fits our data to the pretrained tree model and works on learning using this model.
I will use classification, So I should have two values for features that will be learned. So, I change my rating data to high and low values which will be referred as 1 and 0 respectively. When rating is bigger than 3.5, it is high rated (1) and when less than 3.5, low rated (0).
Accuracy: 0.6777251184834123
I am using the data I have created (df) which includes userId, number of ratings done and average ratings for certain genres.

I am interested in drama ratings of the data. To be more precise, I will ask if the user ranked low or high for the movies with genres that includes Drama. (on average of course since we have created this data using average values.) My decision label should be “drama_rating” column. We can use other data as features to predict the decision label.
k-NN

Accuracy results with original data

Accuracy results with normalized data
Describe which one performs better and why. Describe which features works best for each ML Technique.
I have obtained 0.6777251184834123 accuracy with decision tree model. With k-NN approach, I can have
around 0.76 acurracy best with k=11. My accuracy result are less than wanted, if it would be more than
0.9 I would say training is successfull. This accuracy results are not bad, but not good either. I had better
results using k-NN model since my data was more proper for this approach.
k-NN is used for classification while decision tree can be used for both classification and regression.That
means both can be used for classification. Since I have manipulated my data for classification, they are
both usable for me.
k-NN determines neighborhoods of the data. It assigns a distance metric. This is why when using k-NN, all
features must be numeric. k-NN has low-cost while training and high-cost while prediction.
Decision Tree classifier first build a classification model on the training dataset and then classify. We even
used a created model and fit our data on it. However k-NN classifier does not build any classification
model. It directly learns from the training instances (observations). It starts processing data only after it is
given a test observation to classify. This approach is more lazy.
Decision trees sometimes may cause overfitting which means it gives highly accurate output on training
data, but low accurate output on test data. Decision trees typically don’t improve over linear classifiers
when we have lots of features. They may fail badly on problems that linear classifiers perform well on.
My data uses action movies as features and drama movies as label. From previous works, we know this
are correlated. So, our data is better when used with k-NN.
